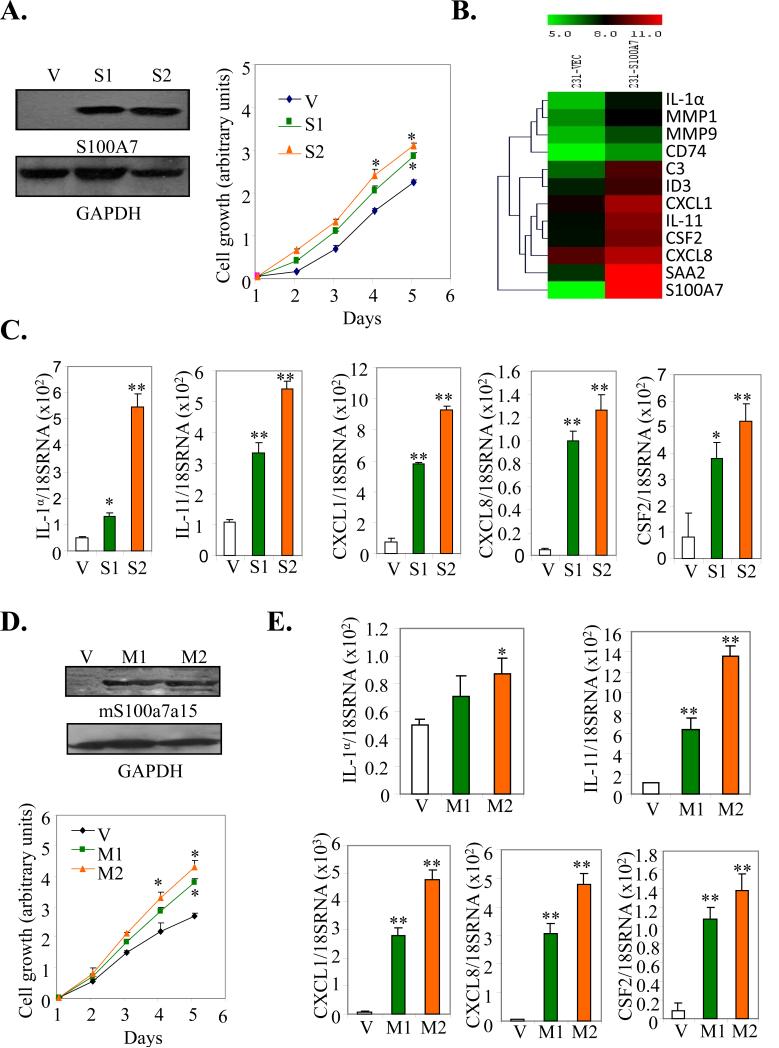
Figure 1. Effect of hS100A7 and mS100a7a15 overexpression on proliferation and pro-inflammatory gene expression.
(A, left) The expression of hS100A7 in two different clones of MDA-MB-231 cells (S1 and S2) was analyzed by WB using hS100A7 specific antibody. GAPDH was used as the loading control. (A, right) Proliferation of hS100A7 expressing MDA-MB-231 (S1 and S2) and vector control cells (V) was analyzed using MTT assay. (B) Heat-map of differentially expressed genes in MDA-MB-231overexpressing hS100A7 (231-S100A7) compared to control (231-Vec). (C) Expression of transcripts for indicated inflammatory markers relative to GAPDH in Vec or hS100A7 overexpressing cells (S1 and S2) by q-PCR. (D, upper) The expression of mS100a7a15 in two different clones of MDA-MB-231 cells (M1 and M2) was analyzed by WB using mS100a7a15 antibody. (D, lower) Proliferation of mS100a7a15 expressing MDA-MB-231 (M1 and M2) and Vec cells was analyzed using the MTT assay. (E) Expression of transcripts of inflammatory markers as analyzed by q-PCR in mS100a7a15 overexpressing clones M1 and M2. All the experiments were repeated three times and representative ones are shown. Graphs represent the mean ± SD for each experimental group.*, p<0.05 and **, p<0.01.

