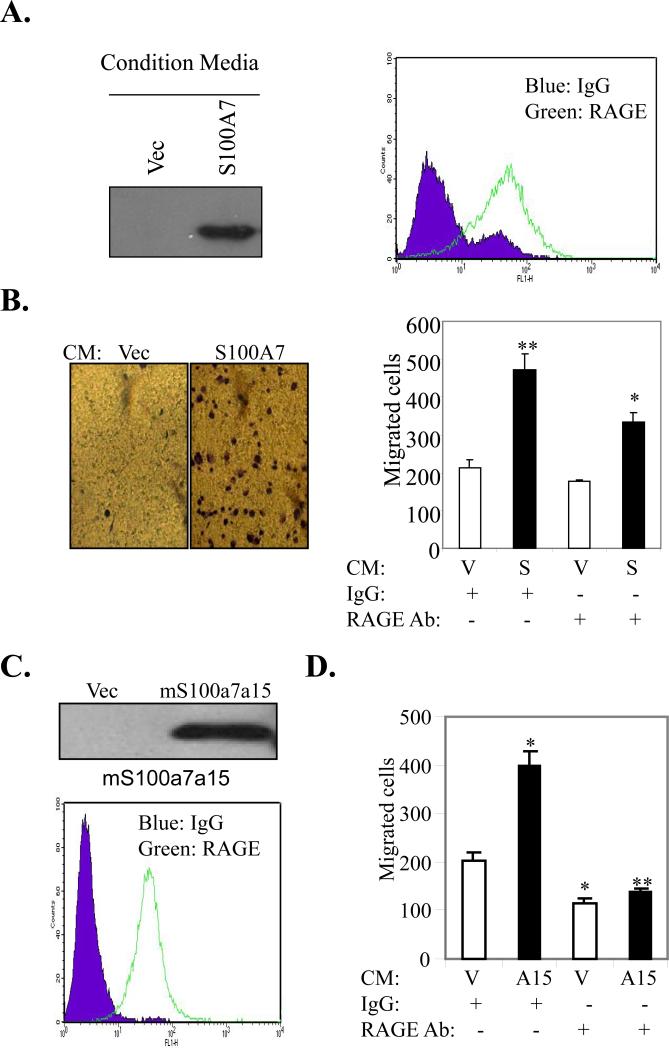
Figure 7. Role of RAGE in hS100A7 and mS100a7a15-induced chemotaxis of macrophages.
(A) WB of CM obtained from Vec or hS100A7 overexpressing MDA-MB-231 cells. (A, left), FACS analysis of RAGE expression in TDM. (B, left) Representative photographs of migrated TDM under phase contrast microscope. (B, right) TDM were subjected to hS100A7 or Vec CM-induced migration in presence of RAGE neutralizing or control antibodies. (C, upper) WB of CM of Vec or mS100a7a15 overexpressing cells. (C, lower) FACS analysis of RAGE expression in MMR. (D) MMR were subjected to vector or mS100a7a15 CM-induced migration in presence of murine RAGE neutralizing or control antibodies. V represents vector, S represents hS100A7 and A15 represents mS100a7a15. Graphs represent the mean ± SD for each experiment repeated three times with similar results.*, p<0.05 and **, p<0.01.

