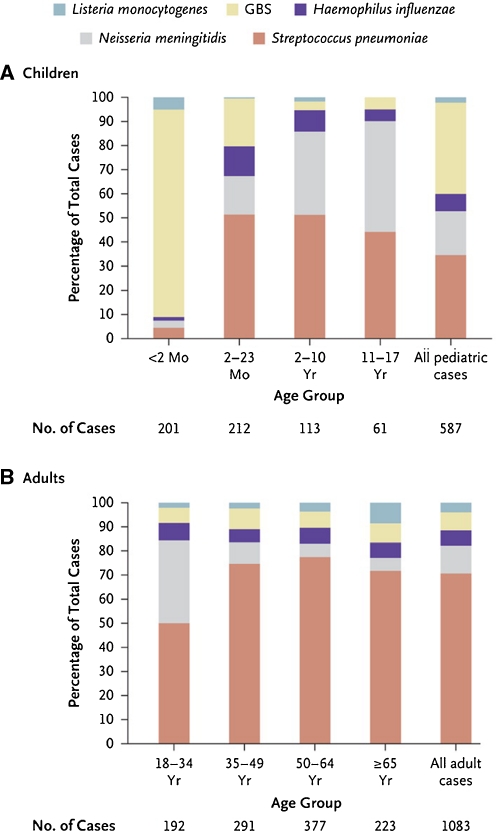
Fig. 1.
Proportions of bacterial meningitis reported from 2003–2007 per age group. Panel A represents data from children and panel B represents data from adults. (Adapted from Thigpen et al. Bacterial meningitis in the United States, 1998–2007. NEJM 2011;64:2016–2025). GBS = Group B Streptococci; Mo = month; Yr = year

