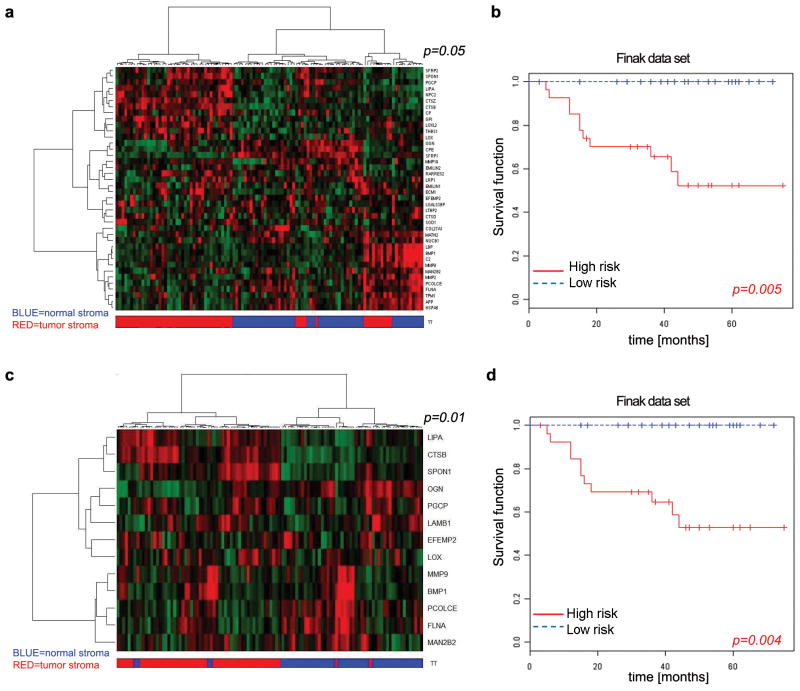
Figure 6. The miR-320 secretome profile separates human breast normal and cancer stroma and predicts patient outcome.
A. Heat map displaying the differential expression in human tumor versus normal stroma of the 40 human orthologs from the 54-factor mouse secretome that were retrieved from the McGill stromal microarray (GSE4823). The p-value indicates the ability of the 40-gene signature to partition normal and tumor stroma compared to 10,000 random permutations (see Methods).
B. Expression of the 40 secretome gene signature present in GSE9014 data set correlates with poor patient outcomes. Kaplan Meir curves of high and low-risk groups based on expression of the 40 gene secretome signature. The permutation p-value of the log-rank test statistic between risk groups is based on 1000 permutations.
C. Heat map displaying the differential expression in tumor versus normal stroma of 13 human orthologs from the 20 ETS2-target genes that were retrieved from the McGill breast cancer stroma microarray, (GSE4823). The p-value indicates the ability of the mouse 17-gene signature to partition normal and tumor stroma as above (see Methods).
D. Expression of the subset of secretome genes directly regulated by ETS2 (13/20 genes in GSE4823) correlates with poor patient outcomea. Kaplan Meir survival curves of high and low-risk groups based on expression of the 13 gene ETS2-related secretome signature. The permutation p-value of the log-rank test statistic between risk groups is based on 1000 permutations.

