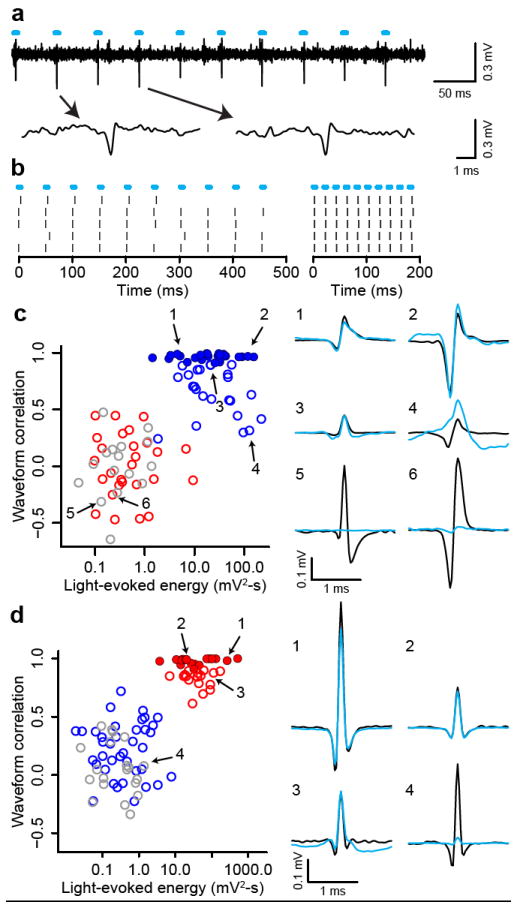
Figure 3. Identifying dopaminergic and GABAergic neurons.

a, Voltage trace from 10 pulses of 20 Hz light stimulation (cyan bars). Two light-triggered spikes are shown below. b, Response from this neuron to 20 Hz (left) and 50 Hz (right) stimulation. Ticks represent spikes. c, Quantification of light-evoked responses and mapping of response types in DAT-Cre mice. Blue, Type I; red, Type II; grey, Type III neurons. Identified dopaminergic neurons are indicated by filled circles. Abscissa: energy (integral of the squared voltage values, ∫v2dt) of the light-evoked response from each neuron. Ordinate: cross-correlation between the mean spontaneous spike and the light-evoked response. Example neurons are shown to the right (black, spontaneous spikes; cyan, light-evoked voltages). d, Light-evoked responses in Vgat-Cre mice. Conventions are the same as in (c).
