
Figure 5.
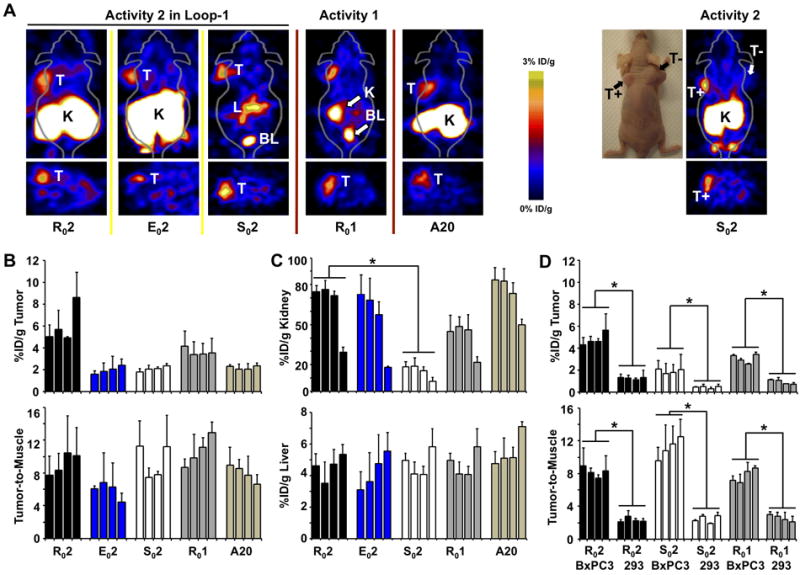
MicroPET images of (a) A431 xenografts are shown at 1h post injection of 64Cu-DOTA labeled R02, E02 and S02 and Ro1. The positive control is indicated by A20. On the far right, a BxPC-3 αvβ6-positive (T+) and αvβ6-negative 293 (T-) double xenograft injected with So2 is shown both as a photograph and microPET image of the same mouse. (b,c) Quantification of microPET images shown in panel a. (d) Side-by-side comparison of R02, S02 and R01 in BxPC-3 xenografts and 293 xenografts (* P < 0.05). (b-d) Four bars indicate 1,2,4 and 24h post injection.