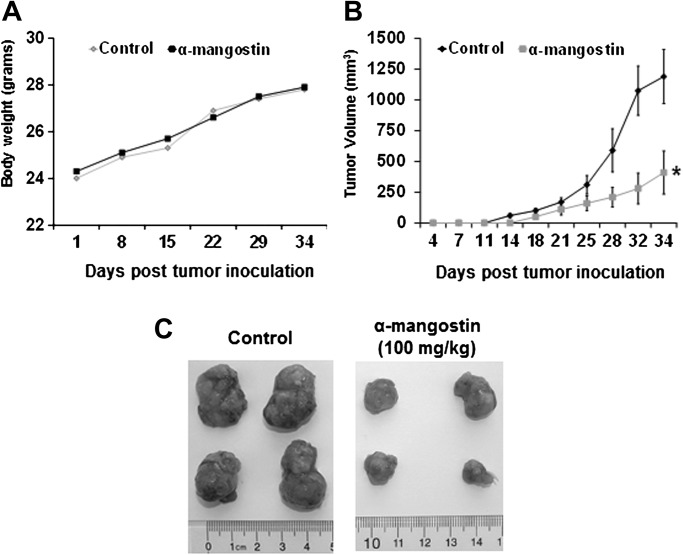
Fig. 6.
(A) Body weights of athymic nude mice treated with α-mangostin were measured one time weekly. (B) Fourteen animals were subcutaneously injected in each flank of the mouse with ∼1.5 × 10⁶ 22Rv1 cells to initiate tumor growth. Twenty-four hours after cell implantation, the animals in each cohort received by oral gavage vehicle or α-mangostin (100 mg/kg). The average tumor volume of control and α-mangostin treated mice were plotted over days after tumor cell inoculation. Data points represent the mean of 14 tumors from seven mice; bars represent standard deviation of the mean, *P < 0.01. (C) Four representative tumors from each cohort at the end of the study are shown comparing control mice to mice treated with α-mangostin.

