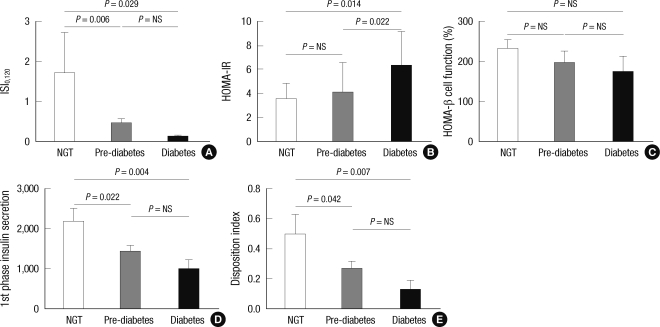
Fig. 2.
Insulin sensitivity index and β-cell function index between the diabetic, pre-diabetic, and normal glucose tolerance groups among 52 acromegalic patients. (A) ISI0,120, (B) HOMA-IR, (C) HOMA-β, (D) first phase of insulin secretion and (E) disposition index in the NGT, pre-diabetic and diabetic groups. Analysis was performed by the Kruskal-Wallis test. Data are the mean ± SD. NGT, normal glucose tolerance; NS, not significant.

