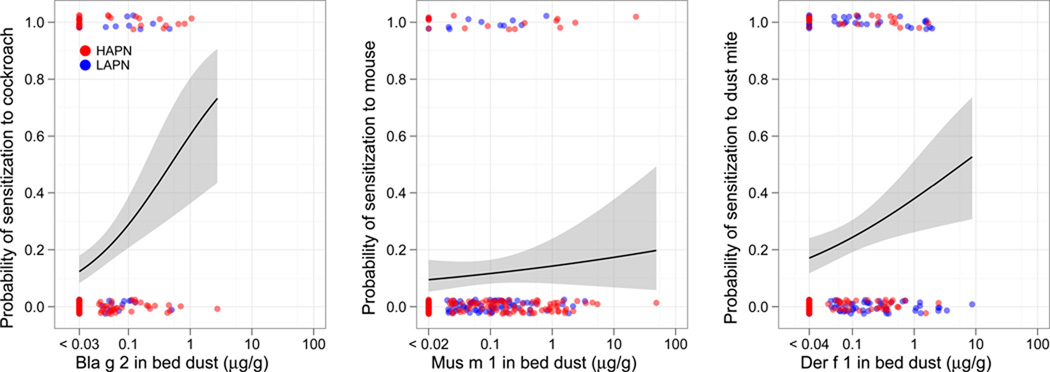
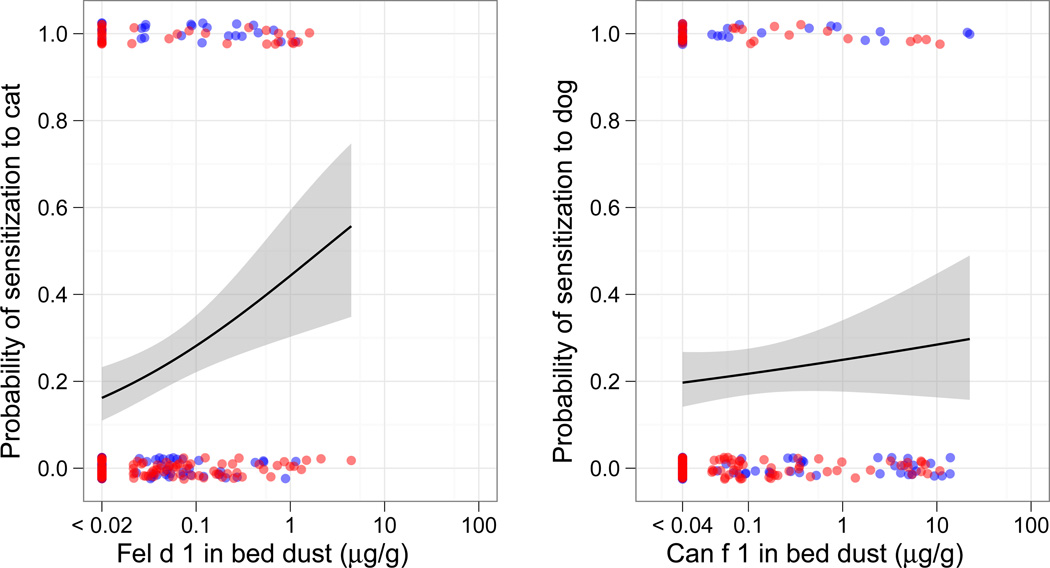
Figure 4. Probability of sensitization to Cockroach (A.), Mouse (B.) Dust mite (C.), Cat (D.) and Dog (E.) allergens with exposure to the relevant major allergen.
Points represent allergen concentration in the bed dust on the x-axis and the absence (0) or presence (1) of IgE ≥0.35 IU/ml to the relevant allergen on the y-axis. Lines represent logistic regression models with 95% confidence intervals (gray).


