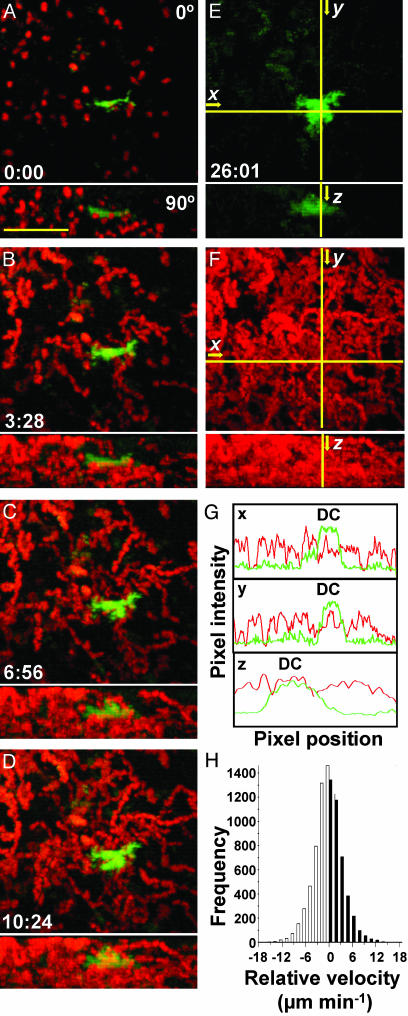
Fig. 4.
T cells approach DCs along random trajectories. (A–D) Cumulative fluorescence images of T cells (red) and DC (green) at indicated times during recording (min:sec). (Bar = 50 μm.) Frames present top (Upper) and side (Lower) views as maximum intensity projections of each orthogonal view across sequential time-lapse sequences (see also Movie 2). (E and F) Color separation of frames to illustrate the area covered by the DC (green) and the even dispersion of T cell tracks (red). (G) Profiles of green and red fluorescence intensity along the x, y, and z axes, marked by crosshairs in E and F showing that T cell density (red trace) does not increase near the DC (green trace). (H) Histogram of T cell velocities (n = 8,700) along vectors normal to DCs, showing an equal distribution of negative and positive velocities.

