
Fig. 11.
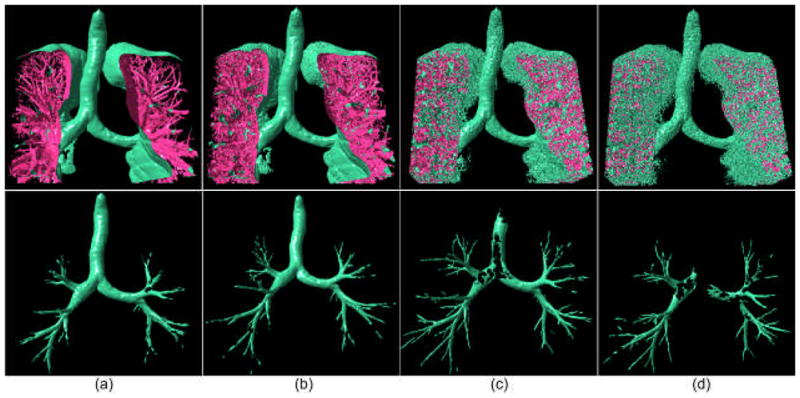
Airway trees are shown (bottom row) after performing the segmentation algorithm on the three-dimensional lung anatomical structures modeled at different iso-values: (a) −750HU, (b) −800 HU, (c) −880 HU, and (d) −900 HU. The airway tree identified at an iso-value of −850 HU is shown in Fig. 10. For better visualization, only a fraction of the lung anatomical structures are displayed.