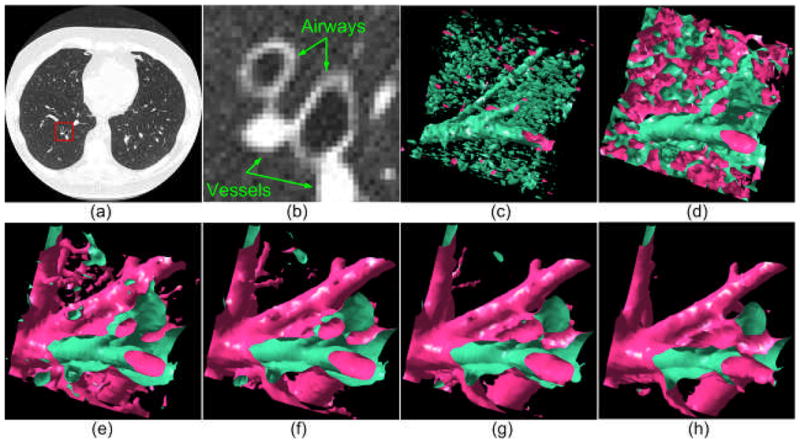
Fig. 3.

An example demonstrating the impact of the iso-value (threshold) on the lung anatomical structure modeling: (a) shows a CT examination, (b) shows the enlarged version of the region indicated by a box in (a), and (c)–(h) show the anatomical structures within the indicated region in (b) as modeled at different iso-values, i.e., −950 HU, −850HU, −750 HU, −650 HU, −550 HU, and −450 HU, respectively. The tubular regions in (c) indicate the inner airway wall regions depicted on the image in (b).
