
Fig. 8.
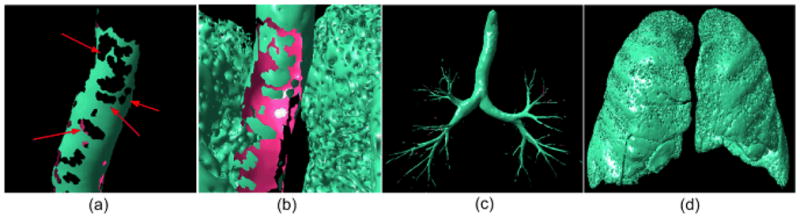
(a) and (b) show local enlargements of trachea regions after applying the normal vector distribution based filtering to regions shown in Fig. 6(b) and Fig. 6(c); (c) and (d) show the airway set (A) and non-airway set (B) after applying the “puzzle game” operation to the regions in Fig. 6(b) and Fig. 6(c). The arrows indicate the “holes” or missing airway regions.