. 2011 Oct;3(10):465–468. doi: 10.4297/najms.2011.3465
Copyright: © North American Journal of Medical Sciences
This is an open-access article distributed under the terms of the Creative Commons Attribution-Noncommercial-Share Alike 3.0 Unported, which permits unrestricted use, distribution, and reproduction in any medium, provided the original work is properly cited.
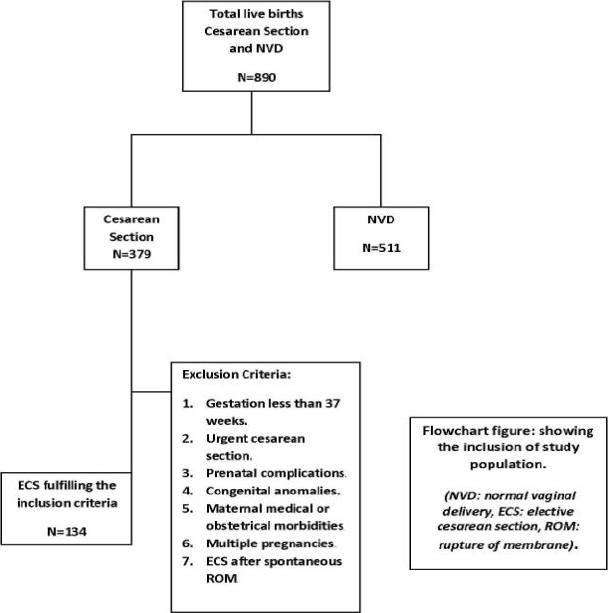
Fig. 1.

Flowchart figure for the inclusion of study population
