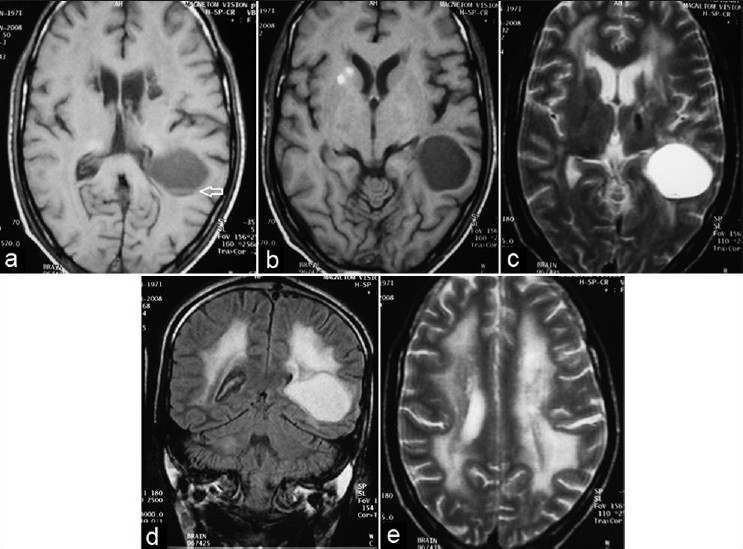
Figure 2.

(a and b) T1-weighted MR image through the basal ganglia shows thalamus and basal ganglia calcification and the cyst with mass effect on the atrium of left lateral ventricle showing blood fluid level (arrow) (c) and coronal (d) T2-weighted MR image shows thalami calcification and the cyst with mass effect. Note T2 hyperintensity in B/L frontal white matter with sparing of corpus callosum (e) T2-weighted MR image shows diffuse symmetric T2 hyperintensity involving bilateral periventricular white matter and centrum semiovale
