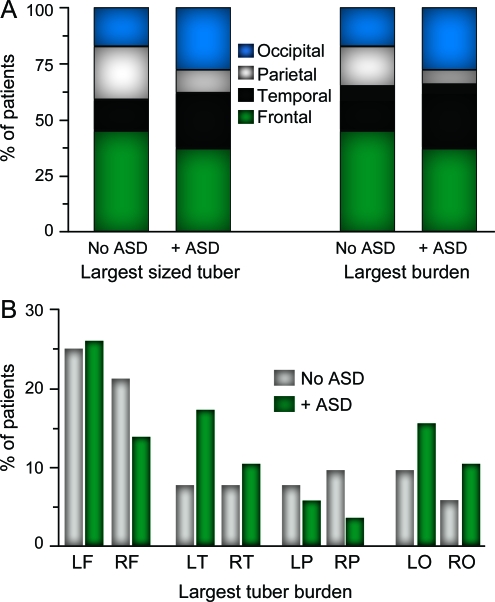
Figure 2. Regional distribution of the largest sized cortical tuber and largest tuber burden in patients with tuberous sclerosis complex (TSC)/autism spectrum disorders (ASD) and without ASD.
(A) Regional percentages represent the cumulative total of the left and right region cases. (B) Largest tuber burden by brain lobe. F = frontal; L = left; O = occipital; P = parietal; R = right; T = temporal.

