Figure 7.
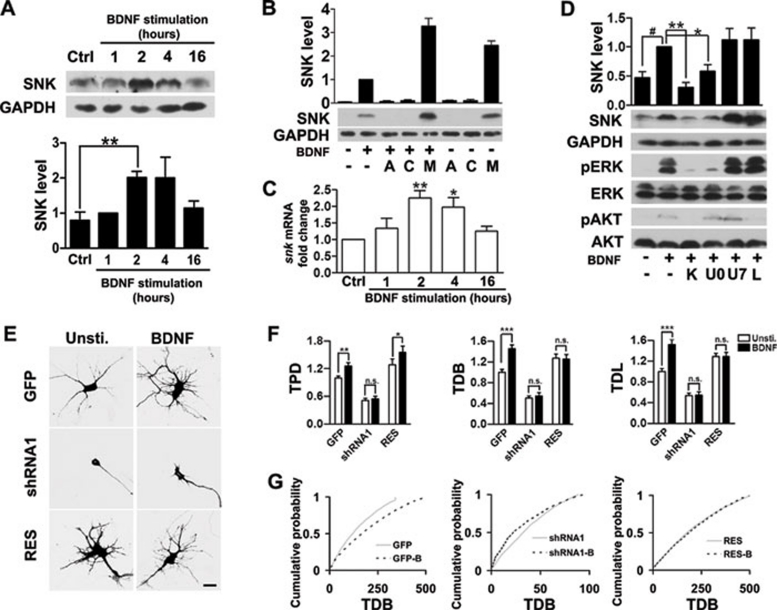
SNK acts downstream of BDNF signaling and is required for BDNF-induced dendritic arborization. (A) Representative anti-SNK western blot of unstimulated (unsti.) DIV5 cortical neurons or DIV5 cortical neurons stimulated with 25 ng/ml BDNF for the indicated time period (upper panel). The negative control group (Ctrl) was treated with vehicle solution. Anti-GAPDH was blotted as a loading control. Lower panel, quantification of band intensities normalized to 1 h stimulation (second bar), n = 4 blots. (B) Anti-SNK western blot of DIV5 cortical neurons treated with the indicated compounds for 2 h (lower panel). BDNF: 25 ng/ml; A: 25 μM actinomycin-D; C: 25 μM cycloheximide; M: 25 μM MG132. Upper panel, quantification of band intensities normalized to BDNF stimulation alone (second bar), n = 3 blots. (C) Quantitative real-time PCR analysis of SNK mRNA expression in cultured cortical neurons treated as in A, normalized to vehicle-treated control. n = 4 independent experiments per group. (D) Western blot analysis of SNK and BDNF signaling pathway members in DIV5 cortical neurons treated with the indicated compounds for 2 h. BDNF: 25 ng/ml; K: 200 nM K252a; U0: 25 μM U0126; U7: 25 μM U73122; L: 25 μM LY294002. Intensities were normalized to BDNF stimulation alone (second bar). n = 5 blots. (E) Representative GFP-immunolabeled DIV4 cortical neurons transfected with GFP alone (GFP), GFP + shRNA1 (shRNA1), or GFP + shRNA1 + RES (RES). Cultures were either left unstimulated or stimulated with 25 ng/ml BDNF for 24 h before fixation. Images were acquired under a 40× oil objective, NA = 1.3. Scale bar, 20 μm. (F) Quantitative analysis of neurons treated as in E. Values represent group means normalized to unstimulated neurons transfected with GFP alone, n > 35 neurons per group. TPD: total number of primary dendrites. (G) Cumulative probability curve of data presented in F. n.s.: not significant; *P < 0.05, **P < 0.01, ***P < 0.001 compared with GFP alone group using ANOVA with post Newman-Keuls test in A-D, and Student's t-test in F.

