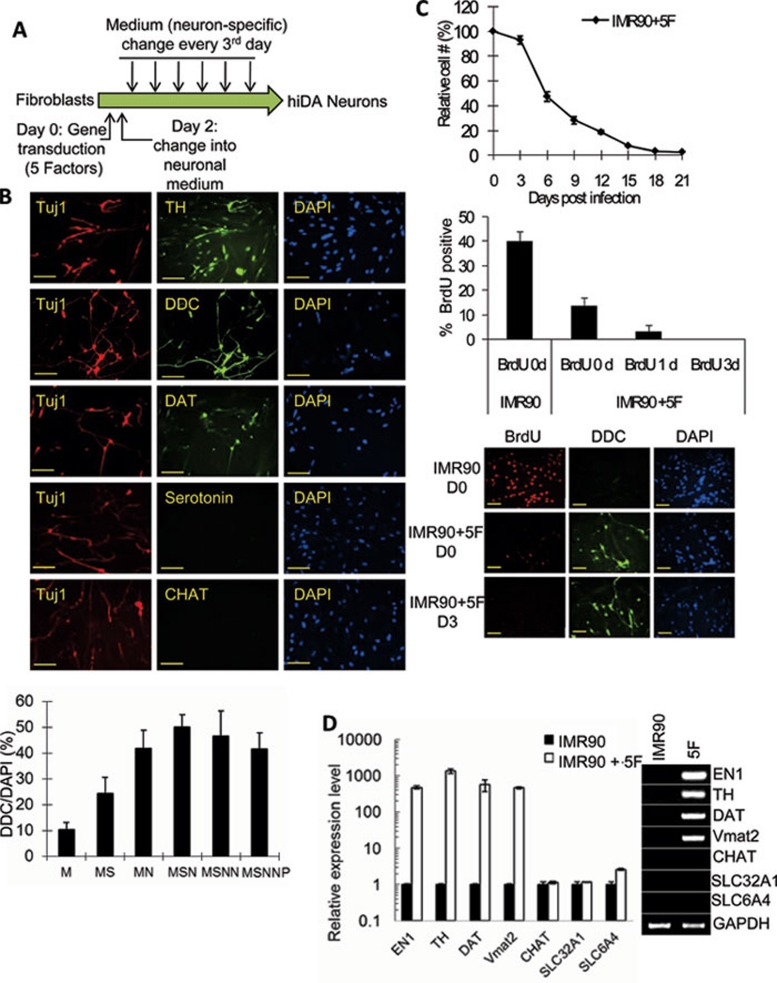
Figure 1.
Successful conversion of human fibroblast into hiDA cells. (A) A schematic illustration of the protocol that we used to transform human fibroblasts into hiDA cells. (B) Top panel: Representative micrographs of hiDA cells stained with various DA neuron-specific (TH, DDC, DAT), general (Tuj1), and other types of neuron (serotonin and ChAT) antibodies. DAPI staining was used to identify individual cells. Lower panel: fraction of surviving cells (stained by DAPI) that stained positive for DDC. The scale bars represent 200 μm. The error bars represent SEM, n = 5. M: Mash1; MS: Mash1 + Sox2; MN: Mash1 + Ngn2; MSN: Mash1 + Sox2 + Ngn2; MSNN: Mash1 + Sox2 + Ngn2 + Nurr1; MSNNP: Mash1 + Sox2 + Ngn2 + Nurr1 + Pitx3. (C) Lack of proliferation in IMR90 fibroblast cells transduced with five factors. Top panel, growth curve of 5F-transduced (IMR90 + 5F) cells; Middle panel, fraction of cells labeled with BrdU when it was added at different times after transduction of 5F; Lower panel: photomicrographs of BrdU staining at day 0 and day 3 after gene transduction. The scale bars represent 200 μm. (D) Q-PCR analysis of key DA-neuron-specific gene expression (left panel). The right panel shows semi-quantitative PCR analysis of the gene. PCR products were electrophoresed in an agarose gel and stained with EtBr. Error bars represent SEM, n = 3.

