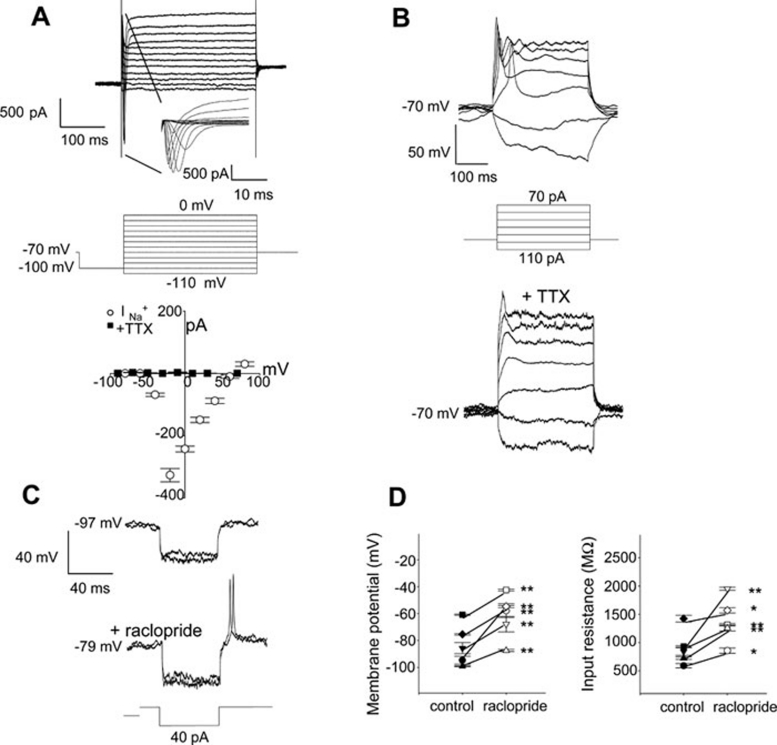
Figure 3.
Electrophysiological profiles of putative hiDA neurons. (A) Whole-cell membrane currents from a representative DIV12 cell held at an initial holding potential of −70 mV was first hyperpolarized to −100 mV before successive 10 mV steps were delivered (average of 5 repetitions at a rate of 1 Hz). Fast, rapidly inactivating inward current, detailed in inset, was followed by a non-inactivating outward current. Fast inward currents were quantified from another cell (DIV11), isolated with cesium-based electrode solution to demonstrate expected ENa+ of +83.5 mV and were completely blocked by TTX (1 μM). Symbols ± SEM bars represent the mean of y-axis currents (pA) in the presence and absence of TTX. (B) Current clamp recording in which current injections maintained a starting voltage of −70 mV, followed by a hyperpolarizing current step (−40 pA) and successive 30 pA steps. In response, a typical DIV13 cell demonstrated fast, rapidly inactivating voltage spikes upon depolarizing current injections, which were also sensitive to TTX (1 μM). These are typical of DA neuron action potentials. (C) Overlay of two consecutive whole-cell recording events shown in a representative DIV21 cell before and after application of the D2-receptor selective antagonist (raclopride, 1 μM). Action potentials resulted after a hyperpolarizing step (−40 pA) in the presence of the antagonist. (D) In the every cell assessed, the membrane potential was significantly depolarized in the presence of raclopride (5 cells, mean ± SEM (mV) *P < 0.05, **P < 0.001, paired Student's t-test) compared to baseline control. The input resistance similarly increased in the presence of raclopride for each cell, suggesting D2-autoreceptor antagonism (5 cells, mean ± SEM (MΩ) *P < 0.05, **P < 0.001, paired Student's t-test, input resistance baseline control versus raclopride for each cell).

