Figure 7.
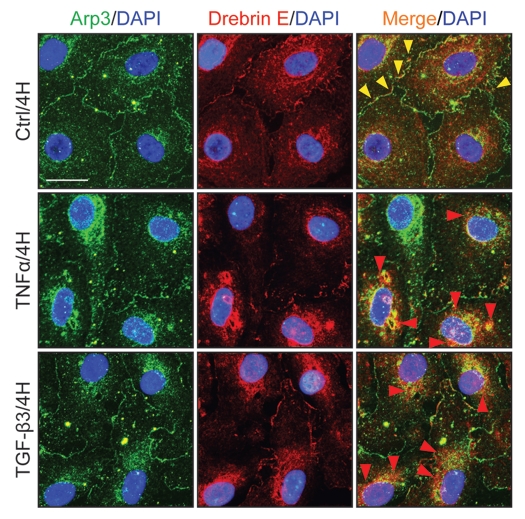
A study by dual-labeled immunofluorescence analysis to assess the effects of cytokines on the distribution of Arp3 and drebrin E in Sertoli cells. Sertoli cells cultured alone at 0.0125 × 10⁶ cells/cm2 on Matrigel-coated coverslips in F12/DMEM for 4 d, forming an epithelium. Thereafter, cells were treated with either TNFα or TGFβ3 for 4 h (hr) including control (Ctrl, no treatment) and terminated for dual-labeled immunofluorescence analysis. Consistent with findings shown in Figures 4 and 6, drebrin E (red fluorescence) was found at the Sertoli-Sertoli cell interface and in the cell cytosol, similar to Arp3 (green fluorescence) and some co-localization (see orange-yellow fluorescence in merged images) was found between Arp3 and drebrin E (see yellow arrowheads at the cell-cell interface), consistent with Co-IP data (Fig. 4). After cytokine treatment, drebrin E was found to undergo re-distribution, moving closer to cell nuclei and Arp3 also displayed a similar pattern of protein redistribution. Additionally, an increase in the co-localization of drebrin E and Arp3 was detected (see red arrowheads), consistent with findings of Figure 4 which showed that an increase in protein-protein interactions between Arp3 and drebrin E was detected by 4 H following either TNFα or TGFβ3 treatment using the technique of Co-IP. Sertoli cell nuclei were visualized by DAPI staining (blue). Bar = 20 µm, which also applies to all other micrographs.

