
Figure 6.
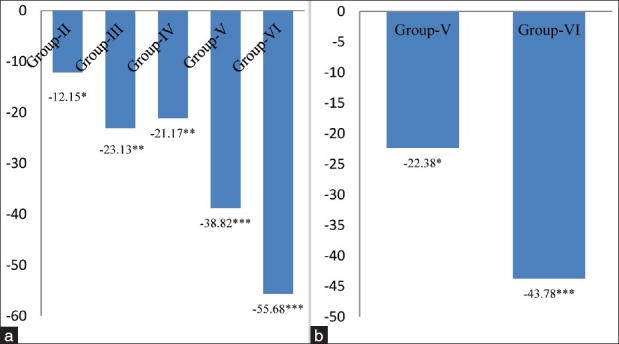
(a) Changes in glutathione peroxidase levels in cardiac tissue of different groups. Values are expressed as mean ± Standard Deviation of six observations. The values in figure represent the percent change with respect to control (Group-I). *P < 0.05, **P < 0.01,***P < 0.001, (b) Changes in glutathione peroxidase levels in cardiac tissue of 4 and 8 mg MSG/g body weight ingested alcoholic animals (Group-V and VI). Values are expressed as mean ± Standard Deviation of six observations. The values in figure represent the percent change with respect to alcoholic animals not receiving monosodium glutamate (Group-IV). *P < 0.05, ***P < 0.001