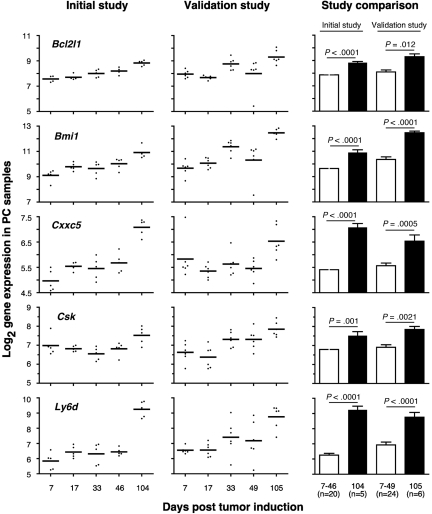
Figure 4.
Expression levels of 5 selected ANOVA-revealed PC genes are up-regulated in frank tumor cells compared with premalignant tumor precursors. Log2-transformed mean gene expression levels (horizontal lines) and individual gene expression levels (dots) at indicated times posttumor induction with pristane are plotted for study 1 (initial study) in the left column and study 2 (validation study) in the center column. The results of statistical comparisons (2-tailed t test) of mean expression levels of combined tumor precursor samples (□; days 7-46 in case of study 1 [n = 20]; days 7-49 in case of study 2 [n = 24]) and tumor samples (■; day 104 in case of study 1 [n = 5]; day 105 in case of study 2 [n = 6]) are indicated as P values in the right column. Bcl2l1 indicates BCL-2-like 1; Bmi, Bmi polycomb ring finger oncogene; Cxxc5, CXXC finger 5; Csk, c-src tyrosine kinase; and Ly6 days, lymphocyte Ag 6 complex, locus D.

