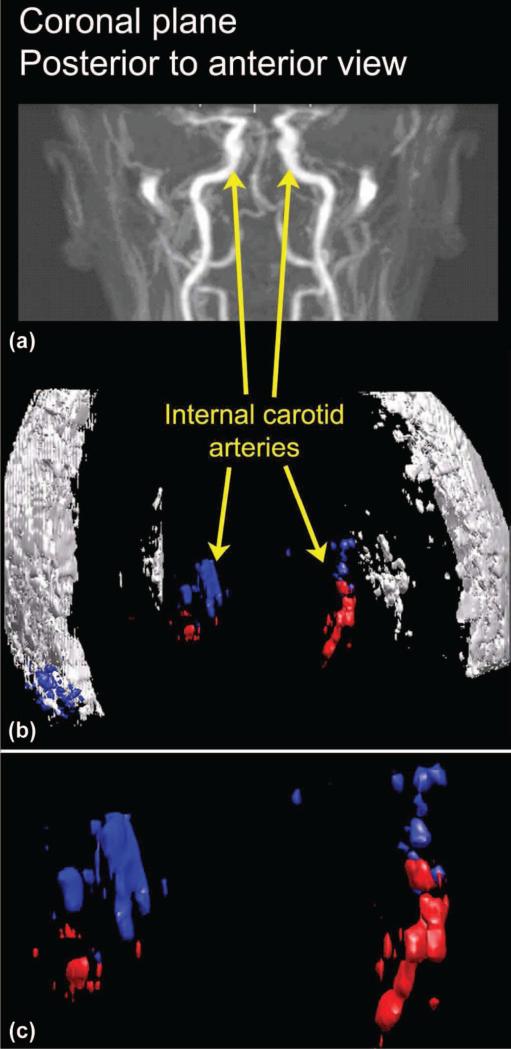
Fig. 10.
(a) The same magnetic resonance angiogram of Fig. 9 is used to indicate the field of view for the registered, (b) rendered ultrasound data acquired without microbubble contrast agent. (c) an enlargement of the color flow data. Blue indicates data acquired by the right transducer; red indicates data acquired by the left transducer. (a) is reproduced with permission of the author, Ofir Glazer, Department of Biomedical Engineering, Tel Aviv University, Israel. 

