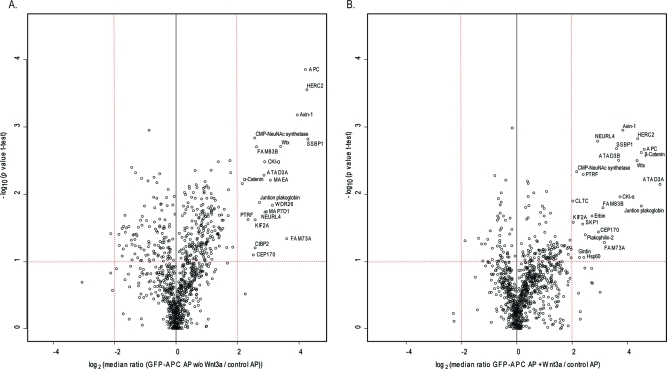
Figure 3.
Volcano plot to determine reproducible APC interactors. (A) Log2 ratios of the median of four pull-downs of GFP-APC against control (x-axis) are plotted versus −log10 of the p-values derived from a t-test. Proteins with a minimum 4-fold change combined with a p-value smaller than 0.1 are considered significant (red lines). (B) Same as (A) but for simulated pull-downs against controls.

