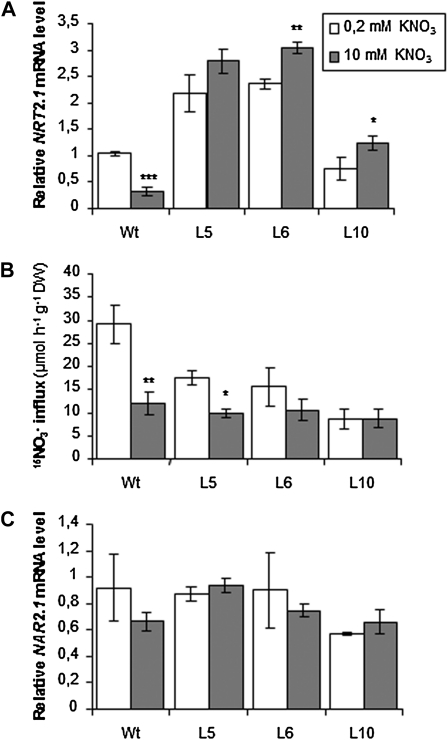
Figure 3.
NO3− influx, NRT2.1, and NAR2.1 mRNA level in roots of wild-type and transgenic plants in response to 10 mm KNO3. Plants were grown in vitro during 8 d on 0.2 mm KNO3 (white bars) or 10 mm KNO3 (gray bars). A, Root NRT2.1 expression quantified by Q-PCR. Values are means of two biological replicates ± sd. B, Root NO3− influx measured at the external concentration of 0.2 mm 15NO3−. Values are means of 12 replicates ± sd. C, Root NAR2.1 expression quantified by Q-PCR. Values are means of two biological replicates ± sd. Differences between plants grown on 0.2 mm KNO3 and 10 mm KNO3 are significant at *P < 0.05, **P < 0.01, ***P < 0.001 (Student’s t test).

