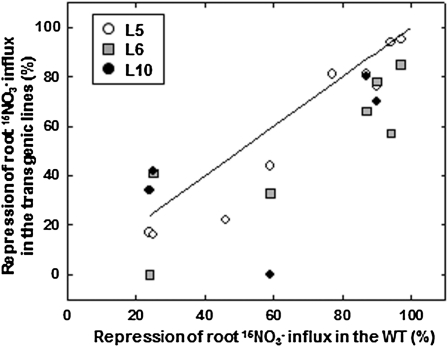
Figure 6.
Effect of constitutive expression of NRT2.1 on the down-regulation of the HATS by repressive N or dark treatments. For all individual experiments performed (those depicted in Figs. 2–4 plus replicate experiments not shown in Figs. 2–4), the percentage of repression of root 15NO3− influx in response to repressive N or dark treatments was calculated for each genotypes as: % repression = (influx in control conditions − influx in repressive conditions)/influx in control conditions × 100. The line indicates the identity function. Thus, all data points below the line correspond to assays where repression of the NO3− HATS was lower in the 35S::NRT2.1 plants as compared to the wild type. All data points are mean of six replicates.

