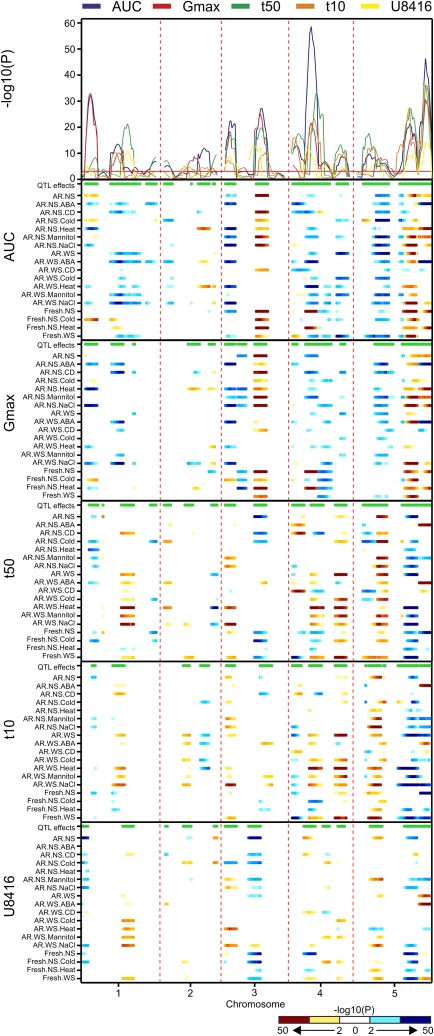
Figure 6.
Genome scan for QTL×E effects for seed germination. The P values for the main effects of the different germination parameters are shown in the top panel. The red horizontal line is the genome-wide significance threshold. The five lower panels show the environment-specific QTL effects. The horizontal green bar at the top of each panel indicates significant environment-specific effects. For both Gmax and AUC, a larger effect of the Sha allele is indicated in yellow-red (Bay-0 in cyan-blue). The color scale is opposite for the t50, t10, and U8416 parameters due to the inversed nature of these parameters.

