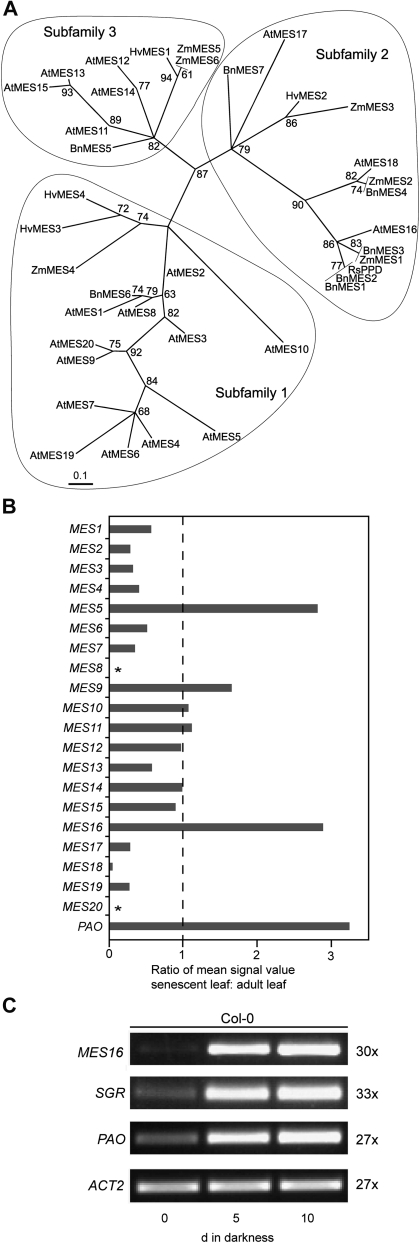
Figure 1.
Identification of MES16. A, Maximum likelihood phylogenetic tree of radish PPD (RsPPD) and MES proteins from Arabidopsis (At), canola (Bn), barley (Hv), and maize (Zm). Branch support values are based on 100 bootstrap replicates and are indicated when higher than 50%. Three subfamilies as determined by Yang et al. (2008) are circled. For sequence accession numbers, see “Materials and Methods.” B, Analysis of senescence-related expression of the Arabidopsis MES family using the Genevestigator Meta-Analyzer tool (Zimmermann et al., 2004). The ratio of mean fluorescence values from senescent leaves (organ no. 44; number of chips, three) and adult leaves (organ no. 42; number of chips, 274) is shown. The value for PAO is shown as a reference. Asterisks indicate that MES8 and MES20 are not represented on the ATH1 chip used for analysis. C, Analysis of gene expression during dark-induced senescence in Col-0. ACT2 was used as a control. Expression was analyzed with nonsaturating numbers of PCR cycles as shown at the right. PCR products were separated on agarose gels and visualized with ethidium bromide.

