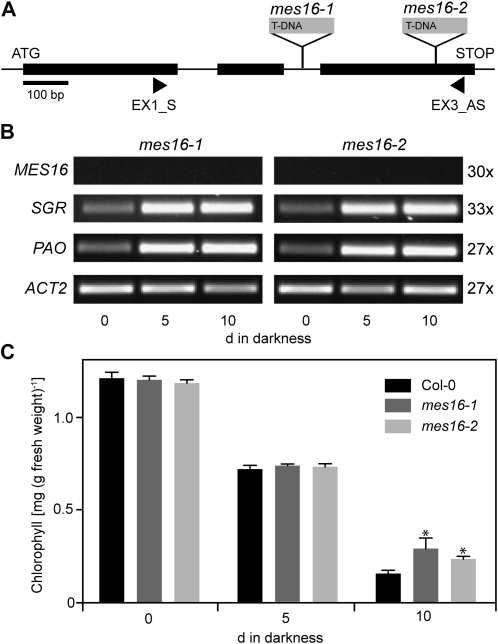
Figure 3.
Deficiency of MES16 does not affect the first steps of Chl degradation. A, Gene structure of MES16 showing the T-DNA insertion sites of two different mes16 mutants studied here. The sites of insertion were verified by sequencing. The positions of primers used for RT-PCR are shown. B, Analysis of gene expression during dark-induced senescence in mes16-1 and -2. ACT2 was used as a control. Expression was analyzed with nonsaturating numbers of PCR cycles as shown at the right. After 30 PCR cycles, which produced clearly visible bands in Col-0 (Fig. 1C), MES16 expression was not obvious in mes16 mutants. PCR products were separated on agarose gels and visualized with ethidium bromide. C, Chl degradation of mes16 mutants during dark-induced senescence. Data are mean values of a representative experiment with three replicates. Error bars indicate sd. The asterisks indicate the significance of differences between the wild type and mes16 mutants at P < 0.03 as determined using a two-tailed t test.

