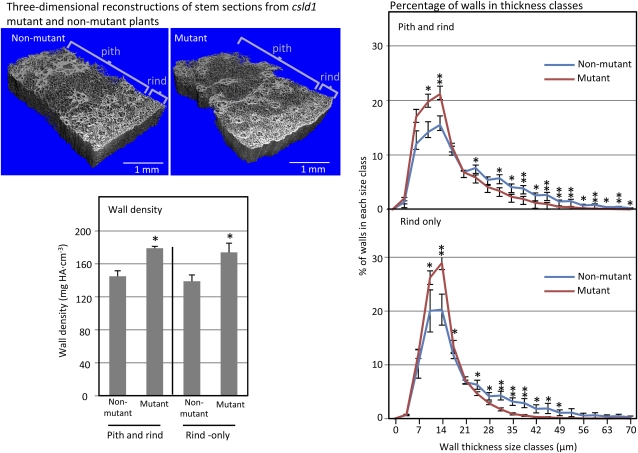
Figure 6.
High-resolution x-ray micro-CT analysis of csld1 mutant and nonmutant stalks. Stem sections from the third internode of greenhouse-grown csld1 mutant and nonmutant plants were scanned at 3.5-μm resolution using high-resolution x-ray micro-CT. Sections for scanning (approximately 3 × 2 × 10 mm) were hand cut from the edges of stems from mutant and nonmutant plants (four each). Nonmutant plants included both wild-type and heterozygous individuals from segregating progeny after three back-crosses into the W22 inbred. Three-dimensional analyses revealed significant differences in the density of wall material (bottom left) and the distribution of wall thickness (right). Mutant stems had more dense, but generally thinner, walls, even when analyses were limited to the rind only. Volumetric analyses were calculated with an algorithm developed for trabecular bone and based on hydroxyapatite (HA) resin standards (Hildebrand and Ruegsegger, 1997). se values are indicated with vertical bars. Values from csld1 mutant plants that are significantly different from nonmutants are indicated with asterisks (** P < 0.05, * P < 0.1).

