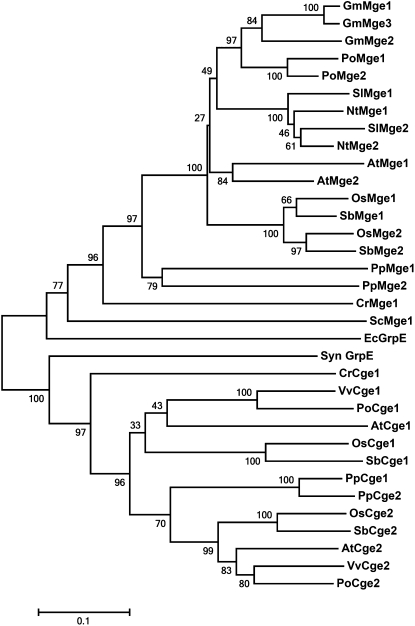
Figure 2.
Phylogenetic tree of Mges and Cges of various species. The tree was generated by use of the neighbor-joining method in MEGA5. Bootstrap values (as a percentage of 1,000 replicates) are provided at the branches. The scale bar represents 10 amino acid replacements per 100 positions. At, Arabidopsis; Cr, C. reinhardtii; Ec, E. coli; Gm, soybean; Nt, tobacco; Os, Oryza sativa; Po, Populus sp.; Pp, P. patens; Sb, Sorghum bicolor; Sc, Saccharomyces cerevisiae; Sl, tomato; Syn, Synechocystis sp.; Vv, Vitis vinifera.

