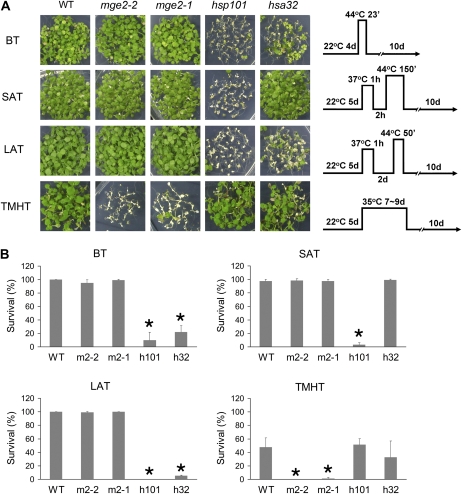
Figure 7.
Thermotolerance assays of Mge2 T-DNA KO lines. A, Phenotypes of Arabidopsis seedlings of the wild type (WT) and various T-DNA KO mutants after 10 d of recovery from the assays under four different HS regimes as schematically shown on the right of each row. Seedlings in the same row were grown on the same plate. B, Survival rates of seedlings after the assay treatments shown in A. The labels for mutants are mge2-1 (m2-1), mge2-2 (m2-2), hsp101 (h101), and hsa32 (h32). The bars present means ± sd of three replicates for each treatment (n ≥ 35 each). * P < 0.01 (versus wild-type plants by Student’s t test).

