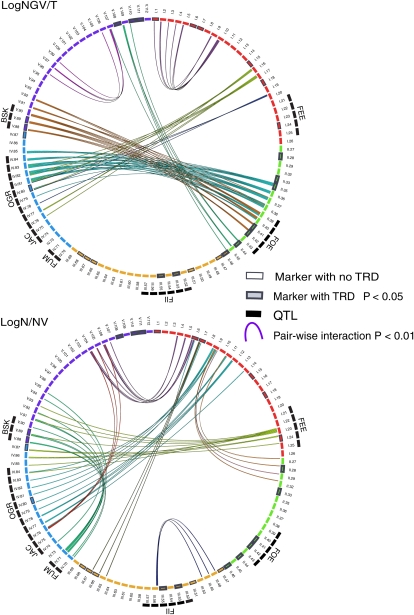
Figure 4.
Loci determining hybrid compatibility interact in a genetic network. The circles depict the A. thaliana genetic map, with intervals represented by circularly arrayed bars colored according to chromosome. A total of 15 epistatic interactions were identified for two of the traits under investigation: %NGV (top circle) and %N/NV (bottom circle). All seven additive QTLs (black outer bars) are involved in at least one epistatic interaction (colored lines). Genetic regions tested for TRD are outlined in gray, with thicker lines and gray fill for those that display TRD (P < 0.05). There are very few interactions shared by early seed traits (%NGV) and maturation/dormancy (%N/NV).

