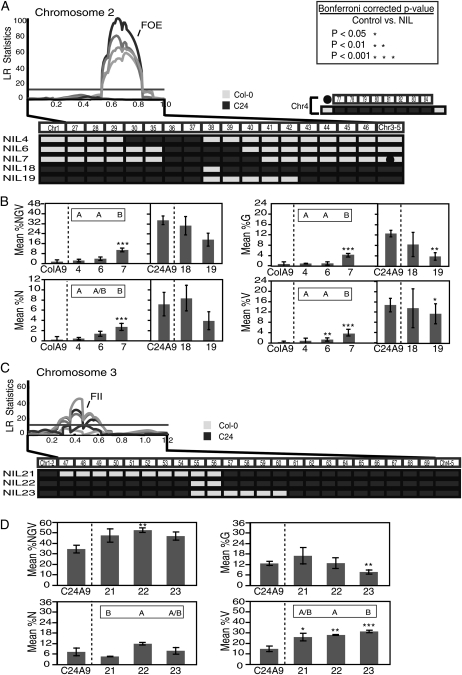
Figure 5.
Fine-mapping of major-effect QTLs reveals multiple loci. A and B, Dissection of the FOE QTL. A, The QTL likelihood plot with FOE localization on chromosome 2 (Fig. 3) is displayed above the map of five NILs with introgressions spanning the FOE QTL. NIL4 to -7 have the Col-0 genomic background, while NIL18 and NIL19 have the C24 background. All contain one introgressed segment, displayed at the bottom, except for NIL7, which contains a C24 introgression on chromosome 4 (middle right). LR, Likelihood ratio. B, Histograms depicting percentage values for four seed traits under investigation (%NGV, %N, %G, and %V). The phenotype was evaluated in NIL F1 × A. arenosa crosses compared with crosses between the background parent (either Col-0 or C24) and A. arenosa (x axis). The mean for each cross is given (y axis) with sd bars. Asterisks denote significant differences in trait means from parental control values based on unpaired Student’s t test. Corresponding P values are given at top right in A. Letters above each NIL denote significant differences in NIL-versus-NIL trait mean comparisons (P < 0.01). The absence of letters above the histogram indicates that the genotypes were not significantly different. All data were derived from three independent biological replicates, and P values have been Bonferroni corrected to reflect multiple tests. C and D, Dissection of the FII QTL. C, The QTL plot displays FII localization on chromosome 3 as well as three NILs with introgressions spanning the FII QTL. All NILs are in the C24 background with one Col-0 introgression. D, Same as B.

