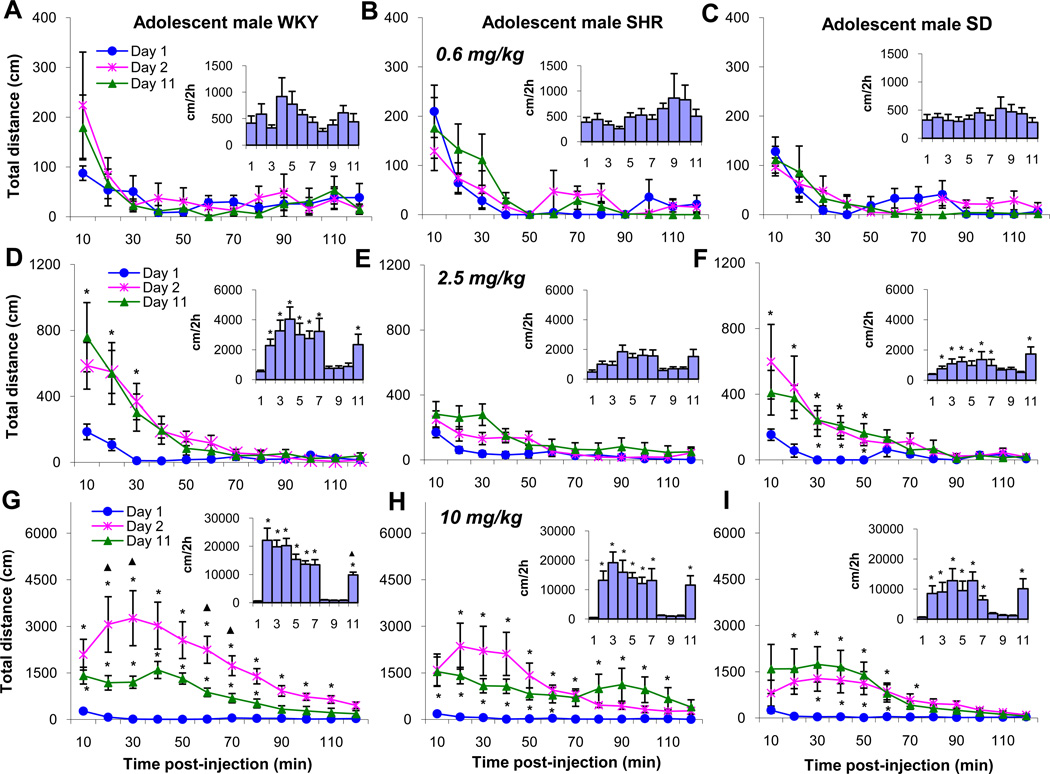
Figure 3.
Sequential, 10 minute distance traveled for 2 hours of ED1, ED2, and ED11 (see Table 1), to show the acute and chronic dose response effect of the 3 MPD doses as well as the total activity (the insert) under the temporal graph for each of the experimental days for the male WKY, SHR and SD rat groups. Label * indicates significant (p<0.05) difference compared to ED1: ▲ indicates significant (p<0.05) difference compared to ED2. The scale for each dose was different to show the dose response.

