Fig. 2.
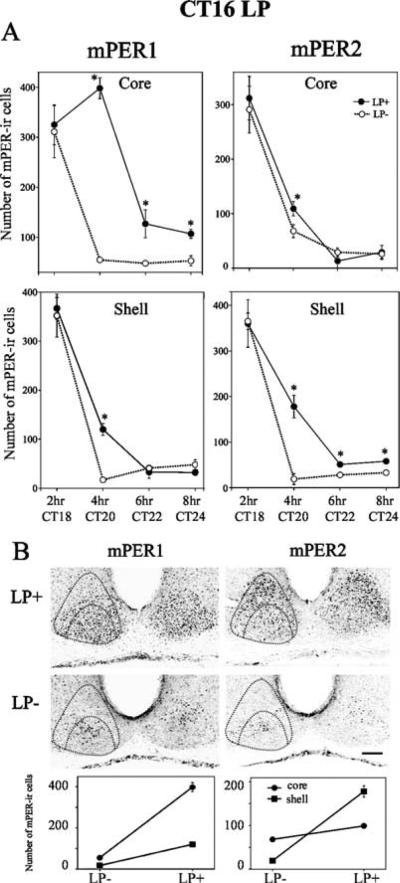
mPER1 and mPER2 expression after a phase-delaying light pulse. Animals were given a light pulse (LP) at CT16, then killed 2, 4, 6 or 8 h after the beginning of the light pulse. (A) Quantitative analysis of the number of mPER1-ir (left panels) and mPER2-ir (right panels) cells in LP+ and control (LP−) groups. The data are presented as mean ± SEM (*p<0.05, t-test). (B) Topographic (upper level) and quantitative (lower level) analysis of mPER1 and mPER2 in the SCN at 4 h in an LP+ and a control animal. In LP+ animals, the greatest increase in mPER1-ir cells occurs in the core SCN, while the increase of mPER2-ir cells is greatest in the shell SCN. Scale bar, 100 μm.

