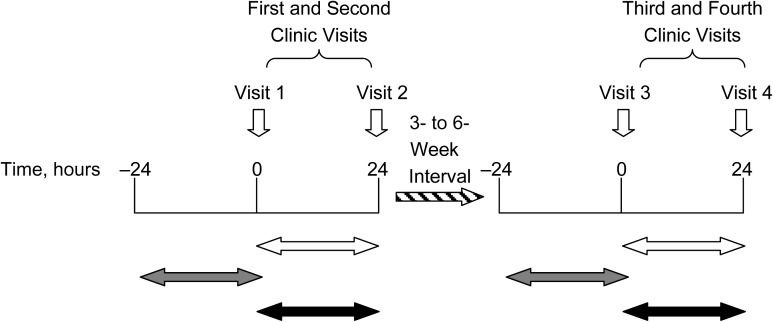
Figure 1.
Twenty-four-hour urine collection periods and corresponding self-reported data on analgesic use, International Study of Macro-/Micro-Nutrients and Blood Pressure, 1996–1999. The white horizontal arrows indicate 24-hour urine collection periods; the gray arrows indicate corresponding information on self-reported food and medication intake based on visits 1 and 3; and the black arrows indicate corresponding information on self-reported food intake based on visits 2 and 4 only and no available information on medication intake.

