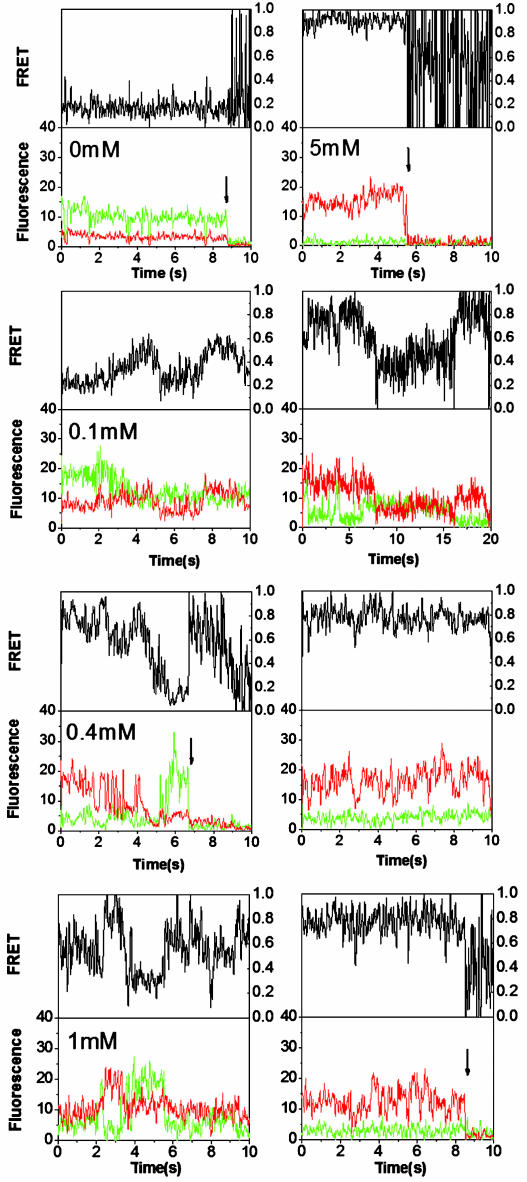
Fig. 3.
Representative single-molecule donor, acceptor, and FRET trajectories, defined by IA/(IA + ID), at various [Mg2+] values; IA and ID represent intensity of acceptor and donor, respectively. The donor and acceptor trajectories are corrected for background emission, including the removal of 10% donor-to-acceptor crosstalk. Photobleaching events of either donor or acceptor are indicated by arrows.

