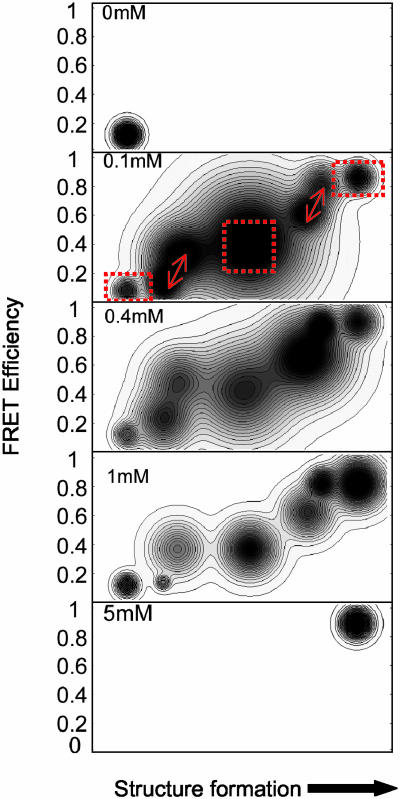
Fig. 6.
Free energy contour plots for [Mg2+] = 0, 0.1, 0.4, 1, and 5 mM for 3′ to 5′ end proximity. EFRET is the y axis, and structure formation is the x axis. The dotted red boxes for [Mg2+] = 0.1 mM highlight three nonfluctuating classes with EFRET = 0–0.2, 0.3–0.5, and 0.8–1, corresponding to distances of >6.3, 6.3–4.2, and <4.2 nm for the FRET pair, which assumes free rotational diffusion, consistent with ensemble data. The two fluctuating classes, reflected by two pairs of closely connected basins, are indicated by arrows at EFRET = 0–0.2 and 0.2–0.4 and at EFRET = 0.5–0.7 and 0.7–0.9. These two pairs of basins correspond to low-to-medium and medium-to-high FRET conversion, respectively.

