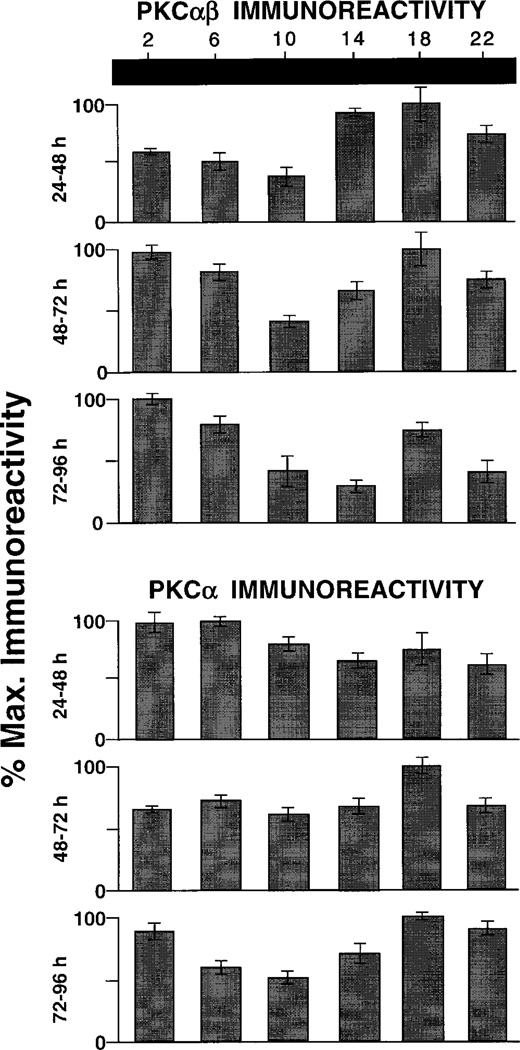
Fig. 7.
Circadian variation in PKC-IR. Bar graphs are organized as for Figure 3. Top: PKCαβ antibody. Upper row: after 24 hours of DD, PKCαβ-IR is relatively low at CT 06–10 and relatively high at CT 14–18, the opposite of what was seen in LD (cf. Fig. 3). The pattern of rhythmic variation is not maintained after 48 (middle row) or 72 (lower row) hours of DD. Bottom: PKCα antibody. There is no clear time-dependent variation in PKCα-IR after 24 or 48 hours of DD. A weak (less than twofold) rhythmic pattern is seen after 72 hours of DD.

