
Figure 1.
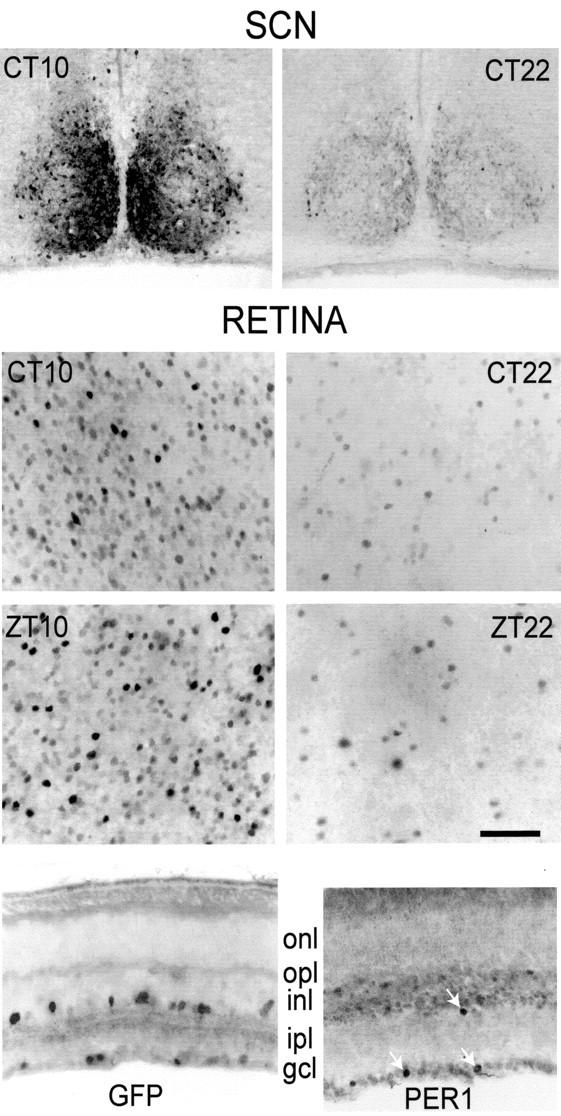
GFP-IR in the retina and SCN. Shown are coronal sections of the SCN (top row) and flat-mount views of the retina focused on the border of inner nuclear and inner plexiform layers (second row) from the same mice killed at CT 10 or CT 22, as indicated. The staining intensity varies markedly from cell to cell, but the fraction of cells with strong GFP-IR is much greater at CT 10 than at CT 22. Shown in the third row are identical flat-mount view of the retinas from mice killed at ZT 10 or ZT 22. In the fourth row, left, is a vertical section of retina showing GFP-IR in neurons at the border of inner nuclear and inner plexiform layers and in the ganglion cell layer. onl, Outer nuclear (photoreceptor) layer; opl, outer plexiform layer; inl, inner nuclear layer; ipl, inner plexiform layer; gcl, ganglion cell layer. In the fourth row, right, is a vertical section of retina showing PER1-IR. Three arrows mark PER-IR neurons at the INL/IPL border and in the GCL. PER1-IR profiles are smaller than GFP-IR profiles because of the diffusion of GFP in the neuron. Scale bar: retina, 50 μm; SCN, 65 μm.