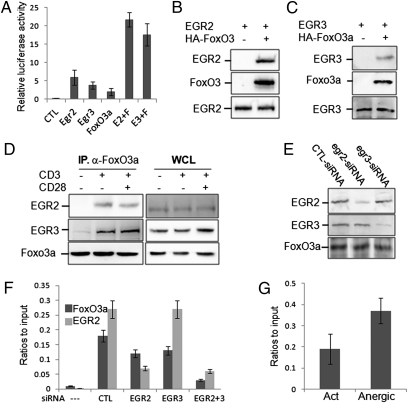
Fig. 3.
Regulation of sirt1 transcription by FoxO3a. (A) pGL4-sirt1-luc plasmid DNA was cotransfected with different combinations of EGR2 (E2), EGR3 (E3), and FoxO3a (F) expression plasmids, as indicated (50 ng each). The luciferase activities in transfected cells were determined. (B and C) HA-tagged FoxO3a expression plasmid DNA was cotransfected with EGR2 (B) or with EGR3 (C) into HEK293 cells. FoxO3a protein in the lysates of transfected cells was immunoprecipitated with anti-HA antibody. The binding of EGR2 or EGR3 with FoxO3a was determined by coimmunoprecipitation and Western blotting. (D) Mouse primary T cells were stimulated with anti-CD3 plus anti-CD28 for 2 h. The interaction of FoxO3a with EGR2 and EGR3 was determined by coimmunoprecipitation with anti-FoxO3a antibody and Western blotting with anti-EGR2 (Top, Left) and EGR3 (Middle, Left) antibodies. The same membrane was reblotted with anti-FoxO3a (Bottom, Left). The protein expression levels of EGR2 (Top, Right), EGR3 (Middle, Right), and FoxO3a (Bottom, Right) in the whole-cell lysates (WCL) were determined by Western blotting as loading controls. (E and F) Naïve T cells were transfected with siRNA against EGR2 or EGR3 by nuclear infection. The cells were then stimulated with anti-CD3 plus anti-CD28 for 24 h. (E) The protein expression levels of EGR2 (Top), EGR3 (Middle), and FoxO3a (Bottom) were determined by Western blotting. (F) The binding of FoxO3a and EGR2 to sirt1 promoter was determined by ChIP assay. The error bars represent data from three independent experiments (mean ± SE). Student t test was used for statistic analysis. (G) The sirt1 promoter-binding activities of FoxO3a in the activated and anergic T cells were analyzed by ChIP assay.

