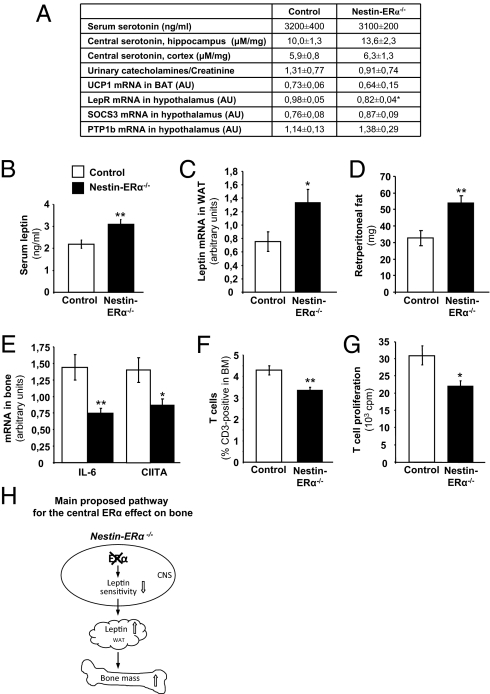
Fig. 3.
Possible pathways for the central ERα effect on bone. (A) Peripheral (serum) and central serotonin levels, measured using ELISA and HPLC, respectively (n = 8–10). Urinary catecholamine secretion (ng/mL) related to urinary creatinine (Cr) (mg/dL) content (n = 7). UCP1 mRNA expression in BAT (n = 5–9). Leptin receptor (LepR), SOCS3, and PTP1b mRNA expression in hypothalamus (n = 5–7). (B) Serum levels of leptin (n = 9–10). (C) Leptin mRNA expression in WAT (n = 6–7). (D) Retroperitoneal fat mass (mg) (n = 6–7). (E) mRNA expression in bone (tibia) of IL-6 and CIITA (n = 9). (F) T-cell frequency (CD3+ cells) in bone marrow (BM) (n = 9–10) and (G) T-cell proliferation in spleen (n = 6–10). (H) Schematic presentation of the main proposed mechanism for the central ERα effect on bone (see Discussion). Values are given as mean ± SEM; *P < 0.05, **P < 0.01 vs. control, Student's t test.

