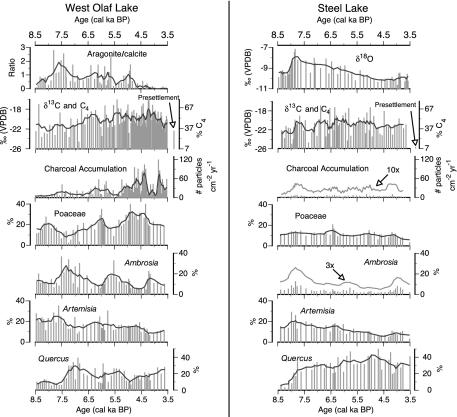
Fig. 3.
Data used for climatic interpretation (aragonite/calcite ratios and δ18O), charcoal δ13C and %C4, charcoal accumulation rates, and Poaceae, Ambrosia, Artemisia, and Quercus pollen abundance at WOL and SL. Bars represent raw data, and black curves are five-sample moving averages of the raw data. Gray curves are exaggerations of the five-sample moving averages.

