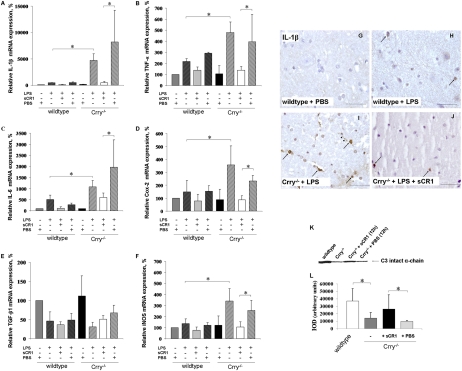
Fig. 3.
Spinal cord expression of inflammatory mediators is up-regulated in Crry−/− mice after systemic LPS challenge. (A–F) Relative mRNA expression of IL-1β (A), TNF-α (B), IL-6 (C), Cox-2 (D), TGF-β1 (E), and iNOS (F) in spinal cords of WT and Crry−/− mice before (−LPS; WT n = 3; Crry−/− n = 4) and after (+LPS; WT n = 5; Crry−/− n = 8) systemic challenge with LPS. Some groups were pretreated at 12 h earlier with sCR1 (+sCR1; WT n = 4; Crry−/− n = 4) or PBS (+PBS; WT n = 3; Crry−/− n = 3). Values are normalized to expression of β-actin and given as percentage (means ± SD) of WT controls. Asterisks indicate statistically significant differences determined by one-way ANOVA. Error bars are for n, number of animals. (G–J) Immunohistochemical staining for IL-1β. IL-1β microglial immunoreactivity is indicated by arrows. (Scale bar: G–J, 50 μm.) (K) Western blot analysis of plasma from Crry−/− mice before and after systemic treatment with one dose (20 mg/kg) of sCR1. Plasma from WT and untreated Crry−/− mice is included as additional controls. C3 intact α-chain is shown (arrow). (L) Densitometry of Western blot analysis. Values are expressed as mean ± SD of the integrated optical density (IOD) for the immunoreactive band. Error bars are for n, number of animals. Asterisks indicate statistically significant differences determined by one-way ANOVA.

