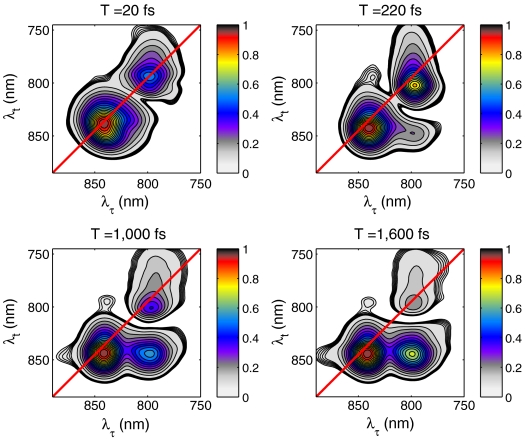
Fig. 2.
Two-dimensional power spectra of LH2 at select waiting times. The acquisition time for each spectrum is 200 ms and is displayed normalized to its highest peak value for ease of visualization. The contour lines are displayed in increments of 0.5% from 7.5% to 9.5% and in increments of 5% from 10% to 100% of the signal maximum for each waiting time. Only the absolute value of the 2D spectra is shown even though the complex third-order nonlinear signal is measured owing to ambiguity in the global phase term. This term does not affect the analysis because it is uniform across the 2D spectrum. From previous transient absorption measurements, the large tail of the 800-nm diagonal peak toward the blue edge of the spectrum arises from excited-state absorption. The deviation of the peak maximum near the diagonal of the spectrum is a result of an ultrafast Stokes shift due to solvent reorganization.

