Fig. 3.
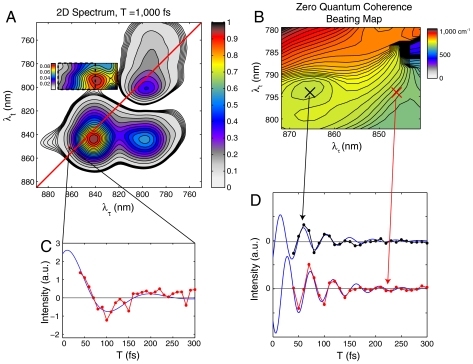
Quantum-beating signal. (A) Two-dimensional spectrum at T = 1,000 fs normalized to its maximum value. The cross-peak above the diagonal is displayed on a different color scale to highlight features. (B) Each region inside the dashed box of A is fit to an exponentially decaying sinusoidal function. The single frequency value of the fit is displayed as a zero-quantum coherence (ZQC) beating map. This map matches the theoretical prediction based on the detuning between coherence and rephasing frequencies to within experimental error. (C) The signal as a function of the waiting time is shown for the (860 nm, 852 nm) voxel along with a fit to an exponentially decaying sinusoidal function. See SI Text for more information. (D) Residual signal (black and red dots and blue fit) is plotted after subtraction of an exponential decay for two points in the region of B (x marks).

