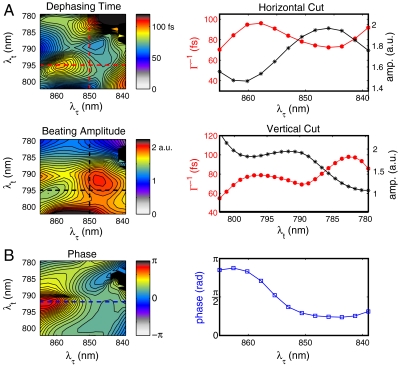
Fig. 4.
Primary factors controlling energy transfer optimization in LH2. (A) Dephasing and beating maps in the upper left cross-peak of the 2D spectrum. Maps are derived from fitting each pixel in the 2D spectrum to the functional form described in the text. The dephasing map is a measure of the extent of system–bath interactions during the waiting period. The amplitude map is proportional to the strength of electronic coupling between excitons on each of the two subunits of LH2. Cuts through the dephasing time (red dashed lines) and amplitude (black dashed lines) maps showing strong anticorrelation. (B) The phase map modulates the quantum mechanical interference between different energy transfer pathways. Cut through a fixed value of the rephasing frequency at 794 nm is shown to the right.

