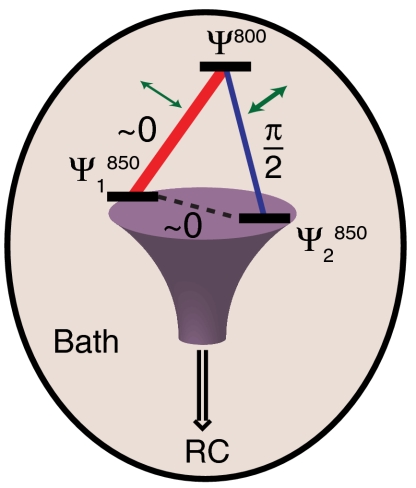
Fig. 5.
Schematic representation of quantum phase interferometry. In LH2, we observe three states coupled together in a loop configuration. Relaxation through different pathways (red and blue) can lead to interference at the lowest energy B850 state in an isolated LH2 complex devoid of the photosynthetic reaction center (RC). The strength of the coupling as determined by the amplitude of the beating signal is represented by the thickness of the line connecting the states (blue and red line segments). The green arrows indicate the extent of system-bath interactions determined by the dephasing rates. The experimentally determined phase terms are indicated to within 0.1 radians of the values measured.

