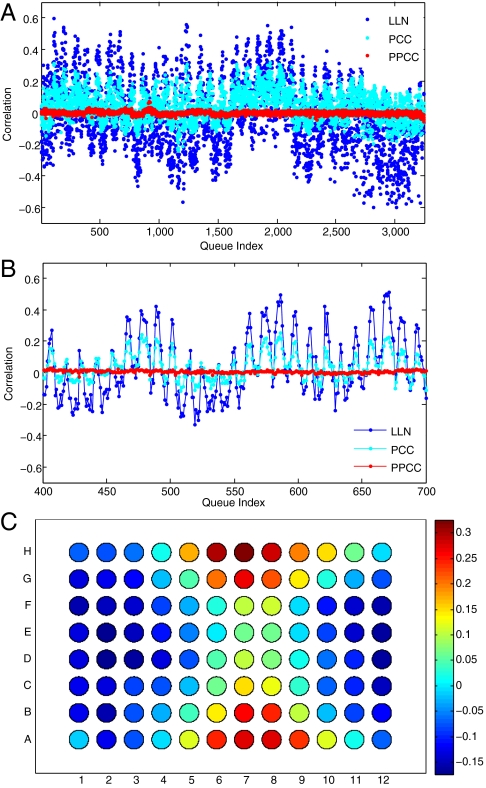
Fig. 7.
Correlation of component 9 with microwell sample coordinates. Variation in correlation of component 9 with extreme (1.5% most positive and negative) probes over 3252 hybridizations has a periodicity of 12 with respect to the queue index (A and B), before (LLN) and after PCC, but not after PPCC. For (C), correlations computed for LLN data were adjusted in each 96-well plate to have a mean of zero and a standard deviation of 1. The adjusted values were then averaged over the same row and column coordinates from the 41 8-by-12 microwell plates in which the samples used for the hybridizations were stored and shipped. These values are displayed in microwell coordinates, with red for highly positive and blue for highly negative correlations.

